Have you ever wondered why some businesses keep generating profits even when their revenue growth slows, while others burn cash despite booming sales?
As companies mature, their revenue growth naturally tapers — what starts as 40–50% annual growth often falls to 10–15%, and eventually even single digits. At that stage, what separates winners from laggards is not top-line expansion, but whether they have mastered the profitability levers that turn revenue into real, sustainable profits and cash flow.
At The Clarity Ledger, our goal is to simplify these financial ideas for students and entrepreneurs. So let’s get clarity on this topic: in this article, we’ll explain the hidden profitability levers in a practical, easy-to-remember way, helping you move beyond vanity numbers like revenue growth and truly assess the strength of a business.
The Profitability Funnel
Every business works like a funnel — money comes in at the top, but leaks out at every stage.

- Revenue → Showcases the money that comes in.
- Gross Profit → what’s left after paying for the product/service.
- Operating Profit → what’s left after salaries, rent, marketing.
- Net Profit → what’s left after paying interest and taxes.
- Free Cash Flow → the real money you can pocket, reinvest, or return to shareholders.
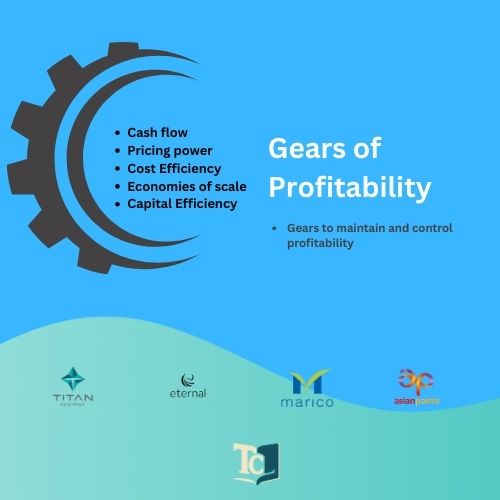
The Five Gears of Profitability
Think of a business as a machine with five gears. If one slips, the whole engine struggles.
1. Pricing Power – The Brand Magnet
Pricing power means the companies can raise prices without losing demand. Taking example of Titan- its subsidiary Tanishq can charge premium for the same gold because customers trust its design and purity.
2. Cost Efficiency – The Smart Buyer
Cost efficiency is buying smarter so margins don’t erode when prices fluctuate like Marico, it sources coconuts directly from farmers, keeping costs predictable.
3. Scale Economics – The Shared Rent
A restaurant with ~100 tables spreads its rent, staff, and marketing over more meals than a 10-table shop. That’s why Zomato is pushing Blinkit hard — fixed delivery costs get cheaper when spread across millions of orders.
4. Capital Efficiency – Money That Works Harder
Titan earns 37% ROCE (FY2024-25), which means every ₹100 invested generates ₹37 annually. Airlines, by contrast, barely cover their cost of capital.
5. Cash Flow Discipline –
Asian Paints collects money from dealers in 7 days but pays suppliers after 30. That timing gap is free working capital. Managing this well often makes the difference between paper profits and real survival.
Titan — “The Compounding Titan”
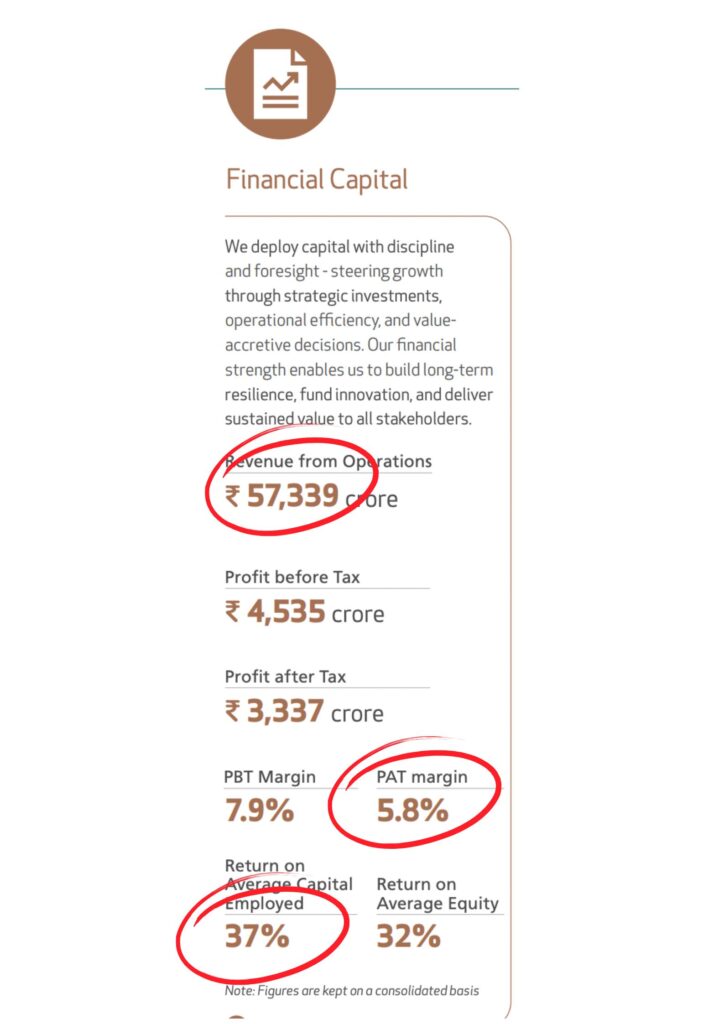
As you can observe in the above screenshot, the figures are taken from Titan Annual report 2024-2025 :
- Revenue: ₹57,339 Cr
- PAT: ₹3,337 Cr
- ROCE: 37% | ROE: 32% | PAT Margin: 5.8%
The real strength of Titan isn’t just its ₹57,000 Cr revenue, rather it’s the quality of that revenue. A 37% ROCE means Titan generates ₹37 in operating profit for every ₹100 of capital invested. For context, many retail companies operate at 10–15% ROCE. Thus, because of this efficiency, Titan can sustain growth even when top-line slows: Every rupee invested works disproportionately harder.
While analysing companies don’t celebrate by just watching Revenue growth, look into Return ratios. High revenue with poor ROCE (assume 8–10%) locks capital into low-yield activities. Titan avoids this trap and thus get fruits of long term compounding.